The data confirms a growing North–South price divide
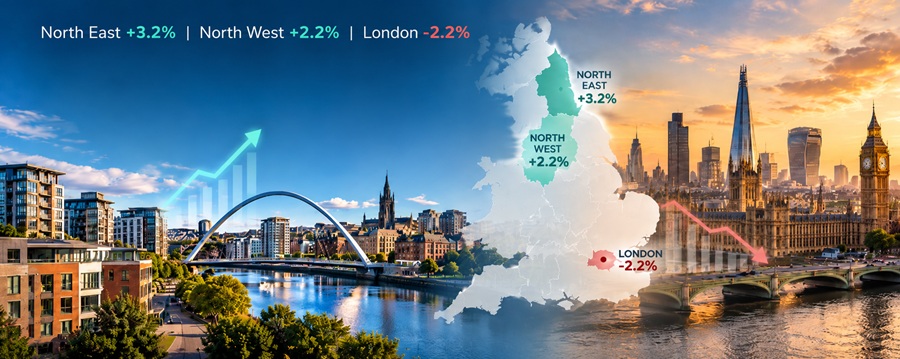
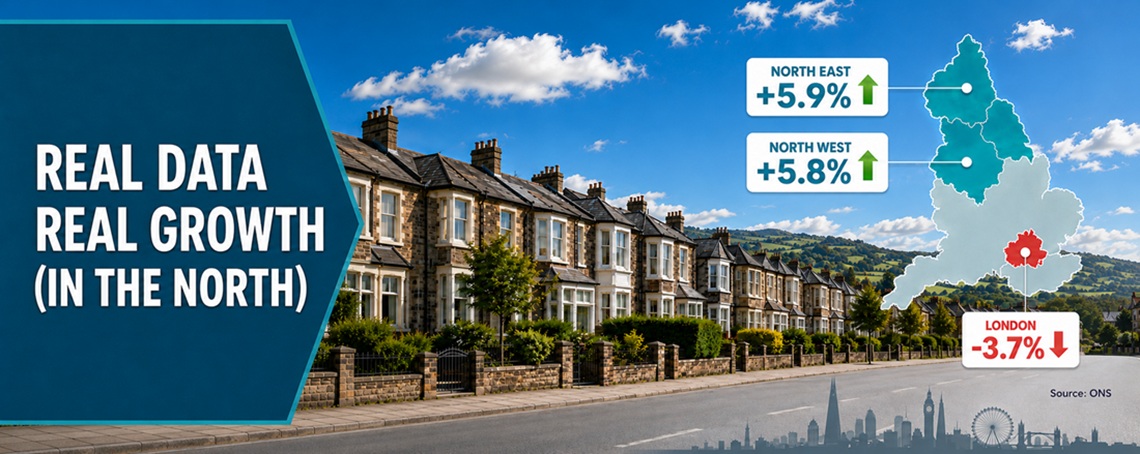
The North East and North West lead house price growth at almost 6%, while London records a 3.7% annual decline.
Growth has moved north
Northern England is now the primary engine of English house price growth. Lower prices keep buyers active while borrowing costs stay elevated, and higher-value southern markets remain under pressure.
The latest house price data from the Office for National Statistics shows the North East leading growth in England, closely followed by the North West. Northern regions continue to significantly outperform London and the South East.
Northern England is the primary engine of English house price growth.
All three northern regions grew considerably faster than the England average of 2.3%.
Regional performance
The North leads the table
The latest figures reveal a clear regional divide. The North East recorded the strongest annual growth at 5.9%, with the North West only slightly behind at 5.8%.
Source: Office for National Statistics, UK House Price Index.
Scale of outperformance
More than twice the England average
Annual price growth in the North East and North West was more than two and a half times the England rate. Yorkshire and the Humber also comfortably exceeded the national figure.
3The three highest regional growth rates were all recorded in northern England.
What is driving it
Affordability widens the divide
Lower property prices across northern England allow more buyers to remain active when borrowing costs are elevated. Smaller mortgages also reduce the effect of interest-rate changes.
Northern England
More accessible to first-time buyers, families, landlords and local owner-occupiers.
London & South East
Larger mortgages place greater pressure on affordability and demand.
Investment outlook
What this means for investors
Affordable northern regions are leading house price growth, while higher-value markets remain under pressure. The figures reinforce the importance of regions where affordability can support sustained activity and long-term demand.
Invest where affordability supports growth.
Buy fully renovated, already rented freehold property across northern England.
Explore our property types↗