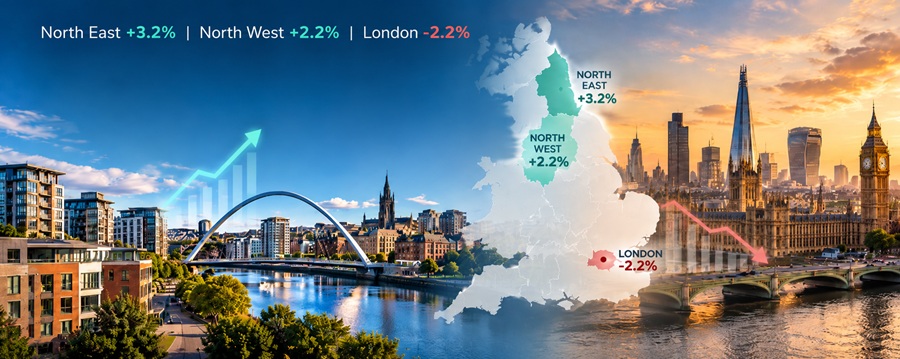
House prices in the North West and North East of England have risen by at least 2% over the past year, making them two of the strongest-performing regions in England, according to the latest Lloyds House Price Index.
The figures, published on 6 November 2026, reveal a widening divide in the UK housing market. While property values have fallen across much of southern England, the North West and North East continue to record annual growth.
The North West recorded a 2.2% annual increase, taking its average property price to £249,916. Meanwhile, the North East achieved 2.0% growth, with the average property valued at £184,318.
These were the two strongest-performing English regions, with the West Midlands the only other region to record positive annual growth, at 0.3%.
For property investors, the latest figures reinforce the importance of looking beyond national averages and focusing on regional market performance.
1.Northern England outperforms the national market
The contrast with the wider UK market is striking. Nationally, house prices fell by 1.2% over the year to October, bringing the average UK property price to £296,285. Prices also declined by 0.6% compared with September.
However, these national figures conceal significant differences between regions. In London, property prices fell by 3.1% annually, while both the South East and South West experienced declines of 2.4%.
Northern regions lead English house price growth (annual %)
Bars show annual percentage change. Regional annual changes use the latest three months of mortgage approval data. Source: Lloyds House Price Index, October 2026.
For investors considering where to purchase property, this regional divergence provides an important reminder: the UK housing market is not moving in one direction.
2.Affordable northern property continues to show resilience
One of the most significant findings in the Lloyds report is the difference in average property values between northern and southern England.
| Region | Average house price | Annual change |
|---|---|---|
| North West | £249,916 | +2.2% |
| North East | £184,318 | +2.0% |
| Yorkshire & Humber | £214,485 | -1.0% |
| West Midlands | £261,656 | +0.3% |
| South East | £379,258 | -2.4% |
| London | £524,892 | -3.1% |
Source: Lloyds House Price Index, October 2026. Figures represent regional averages, not individual investment property prices.
The average property in London now costs approximately 2.85 times as much as one in the North East.
This substantial difference in purchase prices can have important implications for investors seeking to enter the market or expand an existing portfolio.
Lower acquisition costs may allow investors to commit less capital to an individual purchase or spread their investment across multiple properties.
Of course, affordability alone does not guarantee a successful investment. Rental demand, property condition, ongoing costs and achievable rental income must all be considered.
Nevertheless, the combination of comparatively affordable property and positive annual price growth strengthens the investment case for selected northern locations.
3.Why are northern property markets holding up better?
The latest Lloyds figures suggest that regional affordability is becoming an increasingly important consideration in the housing market.
Higher borrowing costs and pressure on household finances have affected buyer confidence across the UK. However, the impact has not been uniform.
In more expensive areas, particularly London and the South East, buyers face considerably higher purchase prices alongside the cost of financing a mortgage.
Northern regions offer a different starting point, with average property values significantly below those in southern England.
This may help explain why the North West and North East have shown greater resilience, although the Lloyds data does not establish affordability as the sole cause of their stronger performance.
"Looking ahead, conditions are likely to remain subdued in the near term, but we don't expect this to lead to a sustained period of falling house prices."
His comments suggest that the current national slowdown should be viewed in the context of a housing market adjusting to higher borrowing costs rather than necessarily entering a prolonged downturn.
For investors, the more interesting development is the difference between regions. While the wider market has softened, selected northern areas have continued to achieve annual price increases.
4.What does this mean for Find UK Property clients?
The latest figures are particularly encouraging for Find UK Property clients, given the company's focus on affordable residential investment opportunities in northern England.
The North West and North East are precisely the regions demonstrating some of the strongest house price performance in England.
There are three important considerations for existing and prospective clients.
Potential for capital appreciation
Annual growth of 2.2% in the North West and 2.0% in the North East demonstrates that property values can continue to increase even when the national market is declining.
For existing property owners, this provides a positive indication of regional market resilience. However, regional averages do not establish the change in value of any individual property.
A more accessible investment market
With average property prices of £184,318 in the North East and £249,916 in the North West, both regions remain considerably more affordable than London and the South East.
This provides a potentially attractive entry point for investors looking to build a residential property portfolio without committing the capital typically required in more expensive southern markets.
Rental income alongside capital growth
Capital appreciation is only one component of property investment returns. For Find UK Property clients, rental income remains an important consideration, particularly during periods of economic uncertainty.
A property capable of generating consistent rental income while also benefiting from potential long-term capital appreciation offers two possible sources of investment return.
Neither is guaranteed, and investors should assess rental demand, maintenance costs, void periods and other expenses before purchasing.
"It's encouraging to see the North East and North West continuing to outperform much of the country. These are areas we've focused on for a long time because they offer more affordable properties and opportunities for investors. The latest figures reinforce the importance of buying in the right locations, at the right price, with rental demand firmly in mind."
 Geno Stafford
Buying Team Leader, Find UK Property
5.A growing case for looking north
The October 2026 Lloyds House Price Index highlights a clear shift in regional performance. Despite a 1.2% annual fall in average UK house prices, the North West and North East have continued to record growth of at least 2%.
The figures do not suggest that every northern market is rising. Yorkshire and the Humber, for example, recorded an annual decline of 1.0%. This reinforces the importance of choosing locations and individual properties carefully.
Nevertheless, the broader message is positive for investors focused on the North West and North East. While expensive southern markets are experiencing falling values, these two northern regions continue to demonstrate resilience, supported by substantially lower average purchase prices.
For Find UK Property clients, the latest data provides further encouragement for a strategy focused on carefully selected, affordable northern residential property, where rental income and the potential for long-term capital growth can work together.
The performance of individual investments will depend on purchase price, location, rental demand and costs, but the latest regional figures offer a compelling reason to keep northern England firmly in focus.
Explore affordable northern property investment
Whether you are building a portfolio or investing for the first time, Find UK Property can help you explore the opportunities available in the North West and North East. Visit www.findukproperty.com or speak to our team today.

About the author: Steven Hickey
Marketing Director, Find UK Property
Steven writes about UK property market data and what it means for investors in Northern England. This article was published on and draws on the Lloyds House Price Index published on 6 November 2026.
Find UK Property is a trading name of International Property Specialists Limited.
Source and data notes
Primary source: Lloyds House Price Index, October 2026, published 6 November 2026.
The Lloyds House Price Index was formerly known as the Halifax House Price Index. The methodology remains unchanged. Regional annual changes are calculated using the latest three months of approved mortgage transaction data. Figures represent market averages and should not be interpreted as forecasts or guarantees of future investment returns.
Disclaimer: This article is provided for general information only and does not constitute financial, legal, tax or investment advice. Property values and rental income can change, and investors should seek independent professional advice before making decisions.