The North Continues to Outperform
The latest reports all point towards the same conclusion.
Nationwide reports annual UK house price growth increased to 2.2% in June, up from 1.7% in May, showing that the national housing market remains resilient despite ongoing economic uncertainty (Source: Nationwide House Price Index, June 2026).
However, national averages only tell part of the story.
Zoopla reports that northern England is recording annual house price growth of 3.5%, comfortably ahead of the UK average of 1.4% (Source: Zoopla House Price Index, June 2026).
The reasons are straightforward.
Affordable regions continue to attract buyers because homes remain within reach even as borrowing costs fluctuate. Lower purchase prices support demand, improve affordability and create the conditions for sustainable long-term growth.
The North East and North West are benefiting from exactly these market fundamentals.
Affordability Is Changing the Market
Today’s housing market is increasingly being shaped by affordability.
As mortgage costs have risen, buyers have become much more price conscious. The impact has been far greater in expensive markets than in affordable ones.
According to Zoopla, average mortgage repayments have increased by around £244 per month in London since the start of the year. In the North East, the increase has been approximately £69 per month (Source: Zoopla House Price Index, June 2026).
That difference matters.
Higher borrowing costs quickly reduce affordability in premium markets, slowing buyer activity and placing pressure on house prices. In contrast, lower-priced northern markets remain accessible to a much broader range of buyers, helping to sustain demand.
City AM also reports that wider economic uncertainty has encouraged a more cautious approach among buyers, particularly in higher-value markets where affordability is already under pressure (Source: City AM, June 2026).
The result is a growing divide between northern and southern England.
Why This Is Good News for Find UK Property Investors
This is exactly why Find UK Property has concentrated on the North East and North West for almost two decades.
Rather than chasing expensive markets where affordability is becoming increasingly stretched, we focus on affordable freehold homes in regions with strong rental demand, attractive yields and long-term growth potential.
The latest data validates that strategy.
Official figures show the North East leading England for annual house price growth, while the North West continues to significantly outperform the national average (Source: HM Land Registry / ONS UK House Price Index, published June 2026).
Zoopla confirms northern England continues to outperform the UK as a whole (Source: Zoopla House Price Index, June 2026).
Nationwide confirms the wider market remains resilient (Source: Nationwide House Price Index, June 2026).
For our clients, these aren’t just encouraging statistics.
They reinforce the long-term investment case for affordable northern housing, where lower purchase prices, strong tenant demand and sustainable capital growth continue to work together.
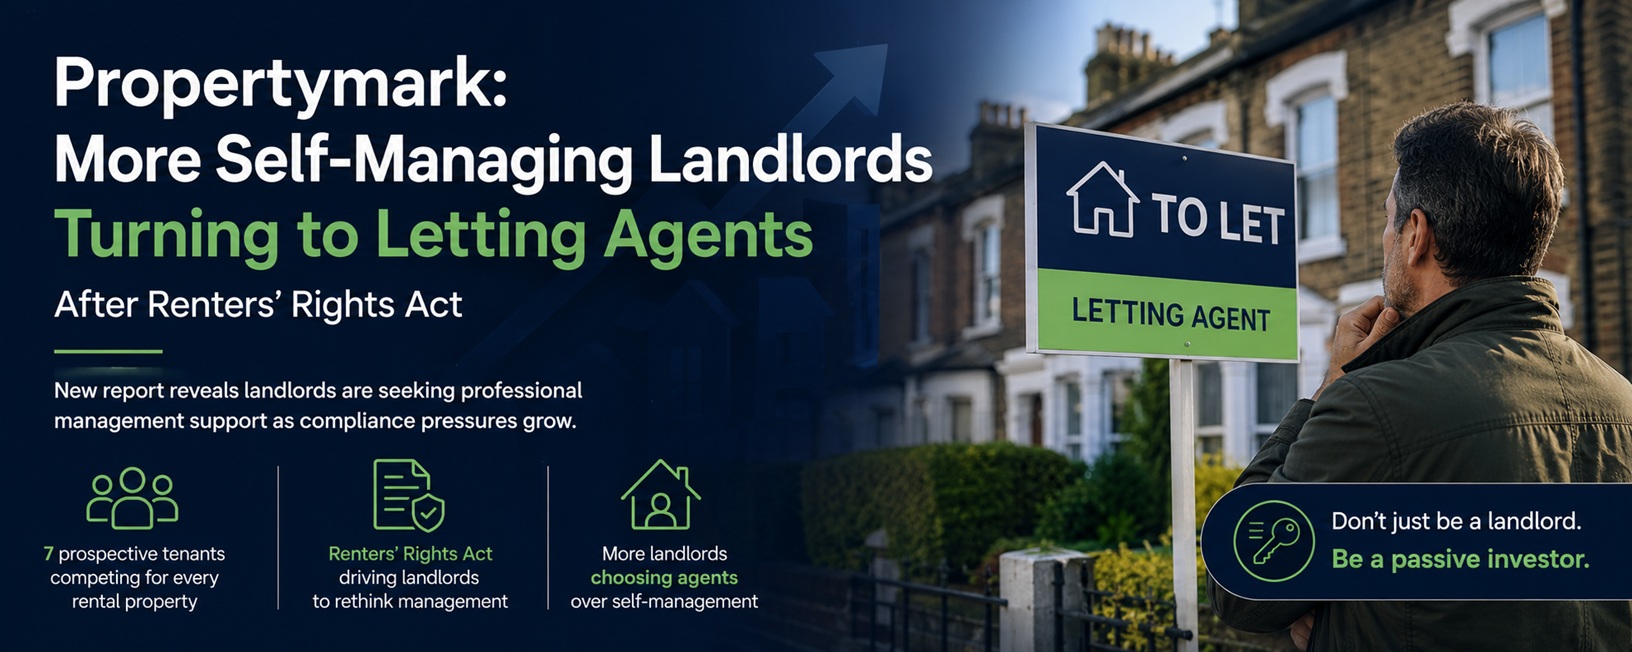
Combined with our fully managed investment model, investors can benefit from these regional trends without the day-to-day responsibilities of managing a buy-to-let property themselves.
Looking Ahead
Nationwide expects affordability to improve gradually as earnings continue to rise and borrowing costs begin to ease (Source: Nationwide House Price Index, June 2026).
Zoopla also expects lower-priced regional markets to remain among the UK’s strongest performers during the remainder of the year as affordability continues to shape buyer behaviour (Source: Zoopla House Price Index, June 2026).
No housing market rises forever, and no region outperforms every year. However, today’s data highlights a long-term shift rather than a short-term anomaly.
The North East and North West continue to combine affordability, strong buyer demand, attractive rental yields and some of England’s strongest house price growth.
For Find UK Property investors, the latest evidence doesn’t change our investment strategy.
It confirms we’re investing in the right places.