PRICES ARE INCREASING BY £2,000
Search

ONS Data - Confirming the North-South Price Growth Divide

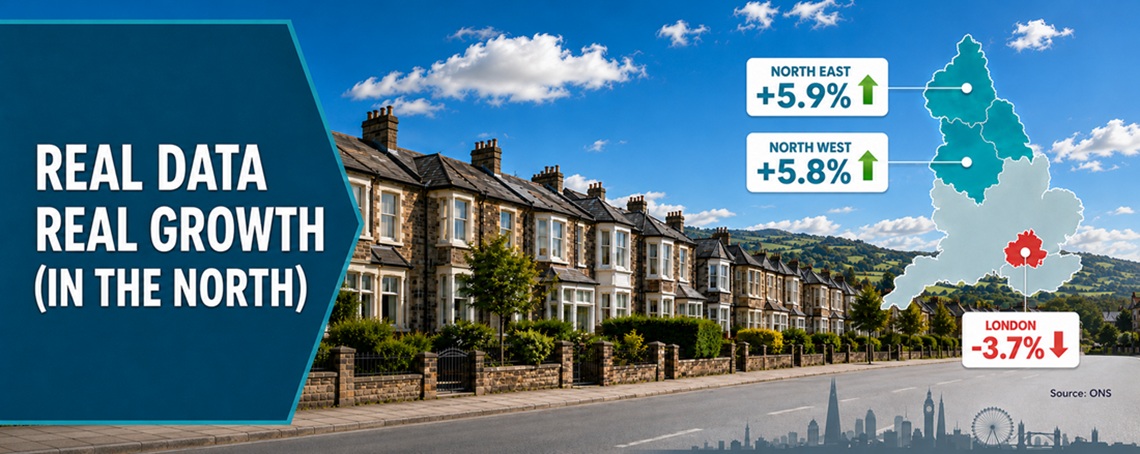
The North East and North West lead house price growth with annual increases of almost 6%, while London records a 3.7% decline.
The latest house price data from the Office for National Statistics (ONS) shows the North East leading growth in England, closely followed by the North West. Northern regions continue to significantly outperform London and the South East.
 

Key stats

AreaAnnual changeMarket position
North East5.9%England’s strongest market
North West5.8%Closely behind the North East
London-3.7%Annual decline


Key takeaway

According to the ONS, northern England is the primary engine of English house price growth, led by the North East and North West.


The North East leads house price growth

The latest ONS figures reveal a clear regional divide:

AreaAnnual change
North East5.9%
North West5.8%
Yorkshire and the Humber4.3%
East Midlands3.2%
West Midlands2.7%
East of England2.3%
England2.3%
South West1.7%
South East1.2%
London-3.7%

Source: Office for National Statistics, UK House Price Index.

The North East recorded the strongest annual growth in England at 5.9%, with the North West only slightly behind at 5.8%. Yorkshire and the Humber also performed strongly, recording growth of 4.3%.

All three northern regions grew considerably faster than the England average of 2.3%, reinforcing the strength and consistency of the northern housing market.


Northern growth is more than twice the England average

ONS data shows that annual price growth in the North East and North West was more than two and a half times the England rate.

Yorkshire and the Humber also comfortably exceeded the national figure, growing almost twice as quickly as England overall.

This is not simply a story of one strong region. The three highest growth rates in the ONS regional data were all recorded in northern England.


London and the South East are the weakest markets

The contrast with southern England is clear.

According to the ONS, the South East recorded annual growth of just 1.2%, around half the England average. London was the only region in the table to record an annual decline, with prices falling by 3.7%.

The difference between the strongest and weakest markets is substantial. Annual performance in the North East was 9.6 percentage points higher than in London.


Affordability is driving the divide

Affordability remains a central factor in the widening regional divide identified by the ONS figures.

Lower property prices across northern England allow more buyers to remain active when borrowing costs are elevated. Smaller mortgage requirements also reduce the effect that changes in interest rates have on monthly repayments.

Buyers in London and the South East generally face much higher purchase prices and larger mortgages. Even relatively small changes in borrowing costs can therefore place greater pressure on household affordability and buyer demand.

Northern markets are better positioned to attract first-time buyers, families, landlords and local owner-occupiers seeking affordable houses.


What this means for investors

The latest ONS data points towards a clear geographical divide in housing market performance.

Affordable northern regions are leading house price growth, while higher-value markets in London and the South East remain under pressure.

For investors, the figures reinforce the importance of focusing on regions where affordability can support sustained buyer activity and long-term demand.

Individual property performance will always depend on factors such as purchase price, condition, property type and street-level demand. However, the wider regional picture is compelling: the three strongest regional growth rates reported by the ONS were all found in northern England.

The North East and North West are leading the market, Yorkshire and the Humber is also outperforming strongly, and all three are growing considerably faster than England as a whole.

Facebook
Twitter
LinkedIn

More News

ONS Data – Confirming the North-South Price Growth Divide

The North East and North West lead house price growth with annual increases of almost 6%, while...

Andy Burnham Is Now The Prime Minister: Five Housing Changes That Could Benefit Northern Property Investors

Why possible changes to Stamp Duty, council tax, property taxation, rent controls and landlord...

Rental Demand Rises as Supply Falls: What This Means for UK Property Investors

Competition for rental homes remains intense across the UK, reinforcing the long-term case for...

What 30 Years of Data Reveals About UK Property

UK house prices have risen in 25 of the past 30 years, showing the long-term resilience of the...

Shares vs Property: The Smarter Route to Retirement Income

Shares and property offer very different routes to building wealth. We compare their risks, income...

Almost 85% Of New Build Houses Are Unsold. Here’s Why Affordable Regional Homes Are Winning

With almost 85% of new-build homes remaining unsold, investors are becoming more selective. This...